
Making Your Own Baseball Analytics Database

Sports, especially professional sports, requires a huge amount of analytical process to turn performances into numeric statistics. These statistics are not only referenced by players and coaches as part of their profession, but also for the media to generate topics and discussions, as well as fans to enhance the quality of their recreation. The production of sporting statistics is not easy, and many organizations have hired a professional team to process them.
Fortunately, with the massive improvement of technology and the creation of new software applications, processing and producing sports statistics have become much easier. For example, database software applications like Ragic can easily be customized into a database for baseball analytics. As Taiwan’s CPBL is the only professional baseball league around the world that is playing at the moment, I have referenced the games and used the statistics to create a personal CPBL baseball analytics database. This database is not only to obtain raw data to calculate but is also formatted to make the sheets easy to view and understand. And with this league not having much English information, I have created a CPBL database in English with all the results and statistics from this season.
The Data Sources
For every sporting analytics database, the most fundamental components are the players and teams since those are the subjects to analyze mainly. Therefore, you would need to find a way to insert the records regarding the teams and players. First and foremost, let’s create a players’ general information sheet and a teams’ general information sheet.
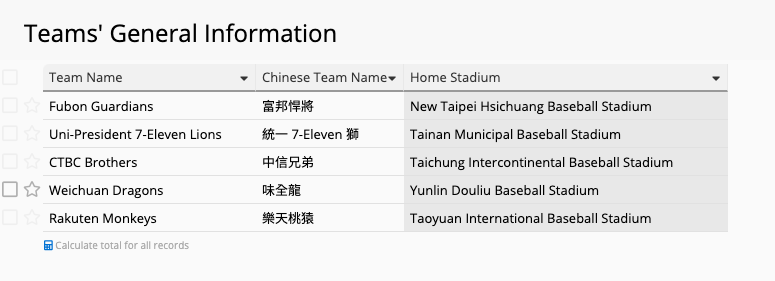
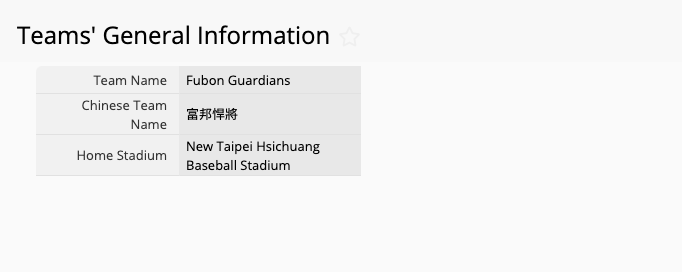
It is suggested to design the teams’ general information sheet first since you’ll then be able to link them in the players’ general information sheet regarding the team each player is affiliated with. This linkage will be essential for calculating the teams’ cumulative statistics that will be discussed in this article later on. You do not need a lot of fields to start with, just make sure that you have values that can be linked to.
Now after the teams’ general information sheet is created, it is time to create the players’ general information sheet. For professional leagues, there are usually some web pages that contain the lists of players and their general information where you can copy or even download from. The CPBL is no different, but only displaying those data in Chinese. The fastest way to get all the players’ data onto Ragic is to create a new sheet by importing from external spreadsheets. I have copied the lists of players’ general information from the CPBL website and posted them onto a spreadsheet software, which can then be imported onto Ragic to create a new sheet with separate records for each player.
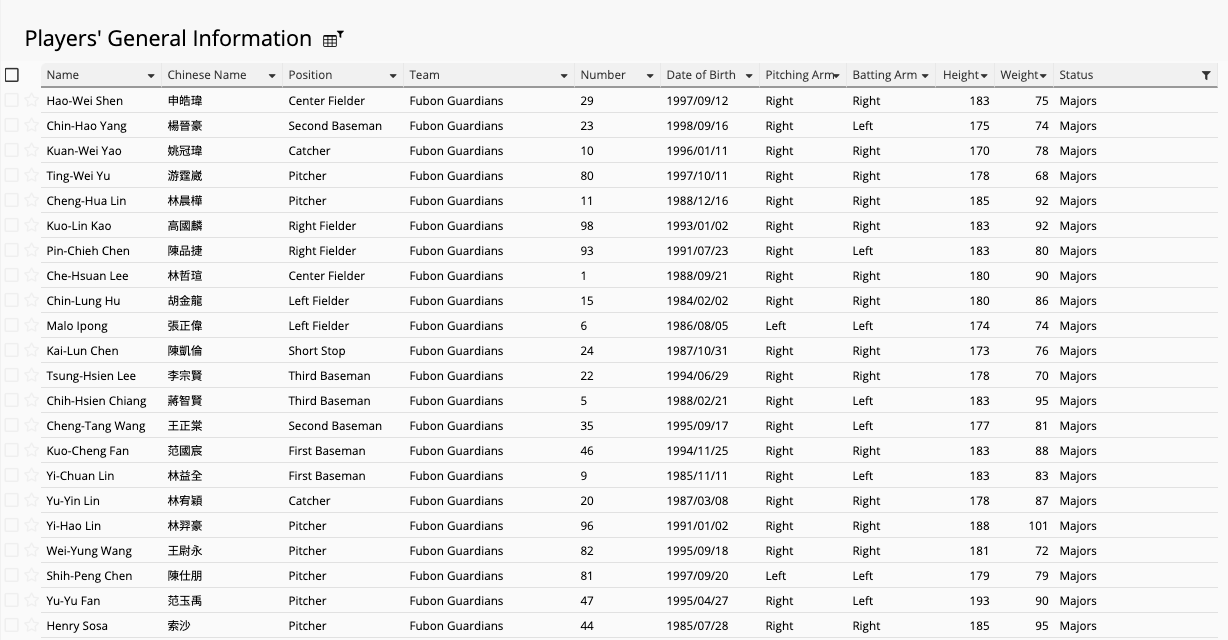
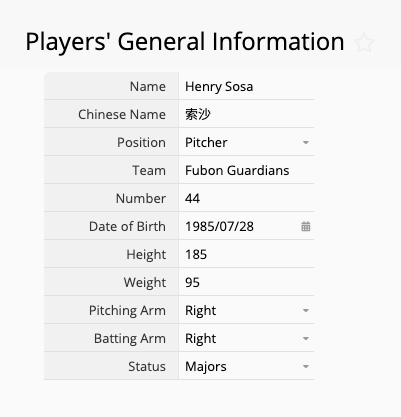
You may still want to modify your players’ general information sheet a bit further. For example, CPBL’s presentation of the players’ general information would make the players’ batting and pitching arms in the same field, as well as their height and weight. You may want to make them into four separate fields to filter or sort your entries more easily, and these settings can be done much faster with formulas in Ragic. Using textual formulas such as LEFT() and RIGHT() will allow you to extract designated strings of text and populate them on new fields. For instance, CPBL presents the heights and weights of the players in the following form: 180/90. Now to extract the height value, you can simply use the formula LEFT(value, 3) on the new height field, and it will automatically populate the height there. For the weight, you can do the same with the RIGHT() formula, but as the weight can be 2 or 3 digits, you’ll need to then filter your records and then manually edit the hundreds digit.
As for the translation from Chinese text to the English language, you can use the IFS() formula to translate the different conditions used. You may use this formula to translate the positions of the players, batting and pitching arm, and player statuses. But unfortunately, you’ll still need to translate the players’ names manually.
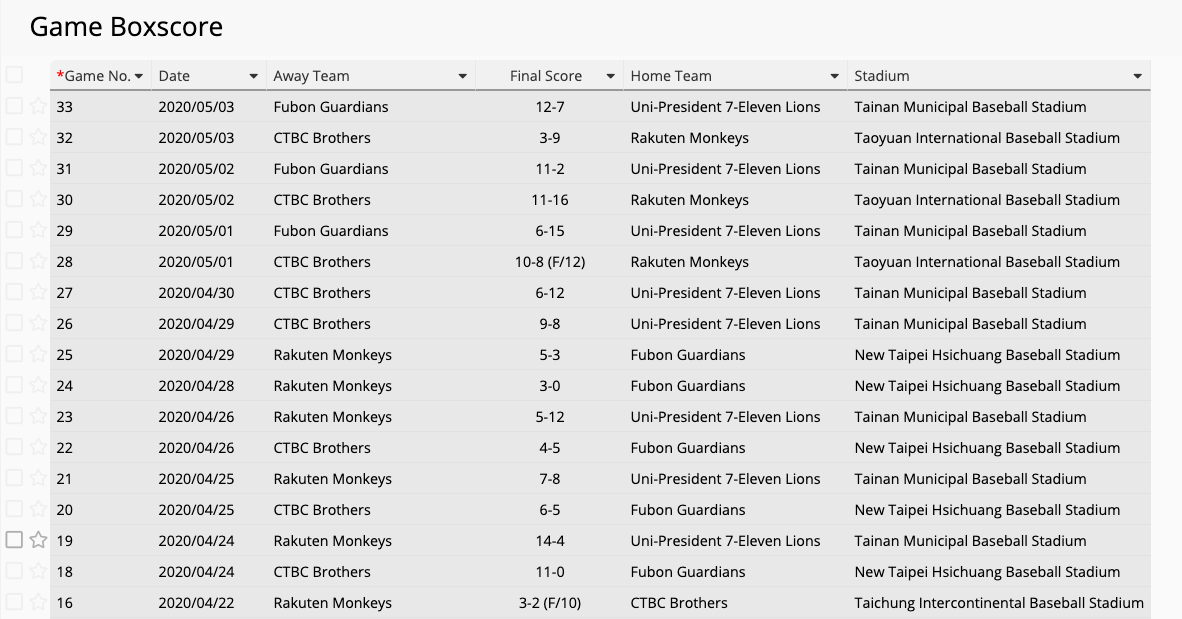
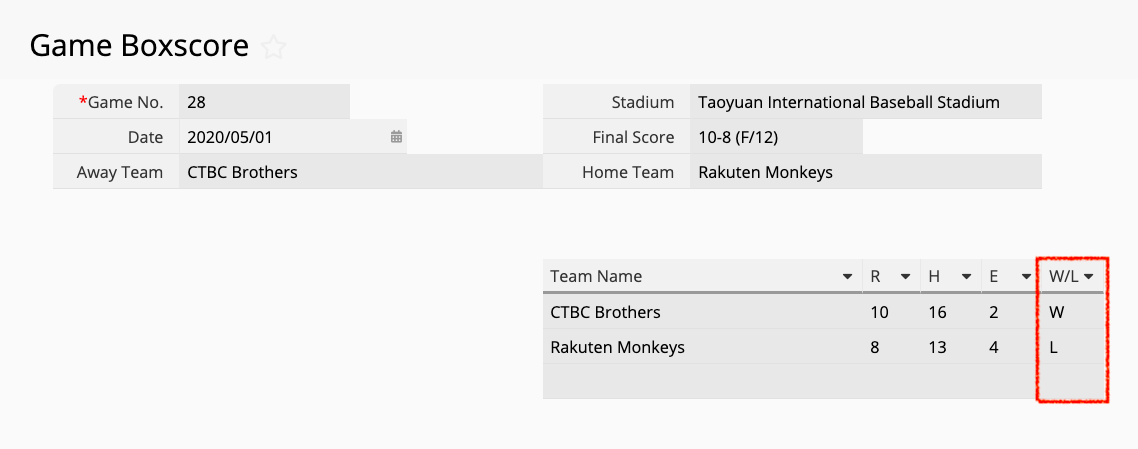
Game Boxscore
The Game Boxscore sheet is the most crucial part of this database as this is where all the raw data for your analytics comes from. In this sheet, you’ll be recording the results and players’ individual performances in each game. So first of all, you’ll need to design the fields needed to accommodate them, including different subtables for the batters’ and pitchers’ individual performances on each team and the teams’ main scorings. You can decide what stats you would like to calculate for each player and team, and then add the respective fields on your subtables.
To make this sheet closely related to your teams’ and players’ data sources, using link and load will be key. For example, you can set to select the teams from the teams’ sheet, and use the link and load with dynamic filtering to select players and load their respective information on the subtables.
Your game boxscore sheet is then completed after all the fields are created and set correctly. You can either type to input the data directly on the Ragic database, or import data from an external spreadsheet document if there is one. For CPBL statistics, I have first entered the general game information in the fields on top of the form. After that, I’ve copied and pasted the detailed players’ statistics of each game onto a spreadsheet and then imported the data onto Ragic. This will minimize the possibility of inputting incorrect numbers as there is not much typing needed in the process.
Converting Innings Pitched for Pitchers' Statistics
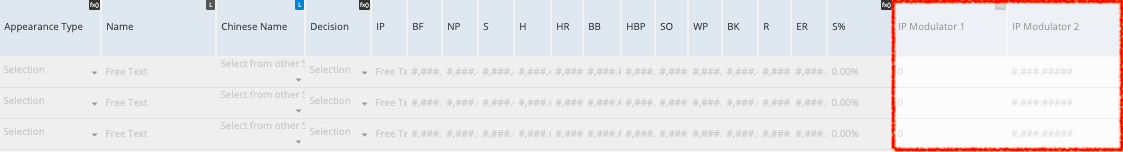
In baseball, the numerical value of the innings pitched is not presented with the normal numeric format. Since there are only three outs to an inning, the largest value in the tenths digit will be “2” rather than the usual “9” (such as 5.1, 5.2, and 6.0). However, the tenths place symbolizes a third of an inning, such as 5.2 innings actually means 5 innings and 2 outs completed.
For calculating stats correctly, you would have to convert the presented inning values to normal numeric values, such as converting "5.2 innings" to "5.666666 innings". To do that, you will need to make the innings field on the pitchers’ subtable to have a free text field type. And you’ll need to create two extra hidden fields on the subtable and set formulas to modulate the innings field. The first modulating field is to use a formula to round the innings field to the ones digit (making 5.1 to 5). The second modulating field is to make the tenths digit into thirds, you can use the formula: (innings field - first modulating field)/0.3. After those are all completed, you can then add the two fields up which will then bring you the correct numerical value for calculation regarding innings.
Calculating Players' Stats
After you have completed your boxscore sheet, the next step is to calculate the cumulative statistics of your players. First of all, you will need to create a new sheet each for pitchers and batters that contains the fields you would like to analyze. These two sheets will not be the sheet to present the players’ cumulative data of the season, but will serve more as a “relay sheet”. We will talk about how to present the data referencing these relay sheets later in the article. These fields would need to be placed individually on your new sheets. And in case you would like to additionally analyze more information than expected, you can simply add all the independent fields that exist on your boxscore sheet and also the fields on the pitchers and batters subtable in respectively.
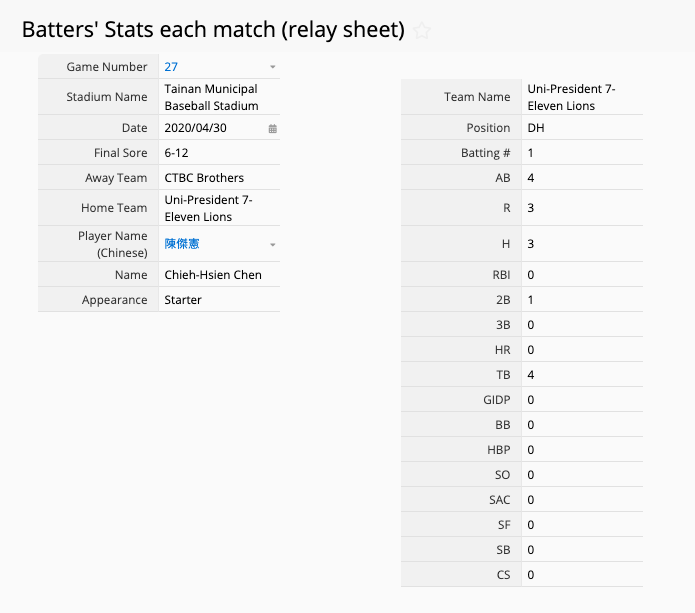
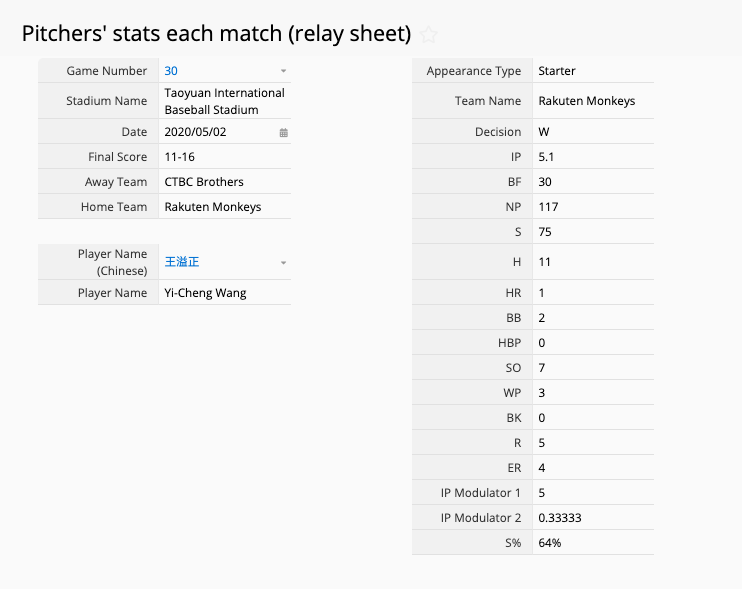
As the two relay sheets are completed, you will need to set the convert records button on your game boxscore sheet and map the fields correctly: the pitchers’ subtable fields will be mapped onto the new pitchers’ relay sheet, and batters’ subtable fields onto the new batters’ relay sheet. By using the convert records function, you’ll be able to combine the subtables in the boxscore sheet for the away team and home team onto one single sheet, which will make it much easier for you to present your players’ statistics.
Now all your players’ performance statistics of each game will be individual entries on the relay sheets. The next step will be to have those statistics populated onto reference subtables for each player. Therefore, you need to make sure that the key field for the players is linked. For this database, the key field would be the players’ Chinese names as they contain unique values.
The fastest way to create new sheets for individual players’ cumulative statistics is to create it by using multiple versions from the players’ general information sheet that was used as the main data source. This sheet is already linked with multiple other sheets, so you can directly add reference subtables on the multiple versions. And since the subtable will consist of the players’ performances on each game he has made an appearance on, you’ll be able to apply formulas referencing the subtable to obtain the cumulative statistics this season. Also, if you would like to break your statistics into different conditions, the conditional IFS() function will be really useful. For this database, there are statistics just calculating either home or away cumulative performances of each player. Other options that many would like to calculate are player performances by stadiums, months, by opponents, etc.
If you would like to rank the players’ performances in different criteria, you may do them on the listing page. First of all, you need to select which fields you would like to view and analyze on the listing pages for batters and pitchers (such as the players’ name, affiliated team, key stats, etc). After that is completed and you have modified the design on the listing pages, you can apply a sort in selected criteria to see how the players rank in them. Certainly, you can apply filters to narrow the records down by teams or by positions.
Calculating Teams' Stats
Teams’ stats is generally the total or the average value of all the players’ stats. Therefore, your teams would need to have a reference subtable referencing the players’ batting and pitching stats sheets. The design process is similar to how you have referenced the relay sheets on the players’ stats sheets; simply just adding a reference subtable and use formulas to calculate the values on subtables. Similarly, it will be easier if your team stats’ is created using multiple versions from the teams’ general information sheets as that sheet is linked to the players’ general information sheet and all its multiple versions. This means that you will not need to create any additional links to use reference subtables on the players’ seasonal stats.
Since it’ll be highly likely to have a lot of subtable fields referenced for calculation, make sure that you hide the fields that might not be ideal to display. For example, you may want to calculate the total number of pitches thrown by the team, but it will be a bit unnecessary to list all the players’ number of pitches thrown this season. For this database, there aren’t any subtable fields on the team stats sheets since if a user would like to view statistics of individual players, he or she can view them on the players’ stats sheets.
Standings
In terms of team stats, there are certain criteria that you cannot directly use the players’ stats as the sources to calculate, such as the game results of each team. For this, we would have to go back to the game boxscore sheet, which is the only sheet that contains results from all games. The “box” is presented in subtables of the sheet with the form of any baseball scoring displays. However, to be able to calculate the statistics of results this season, you would have to make sure to add an extra field that determines the winners and losers of a game.
After making sure that the fields are in the correct format, you will need to create a new sheet from this subtable, which will then populate the results of every team. You can add additional individual fields from the parent sheet as well, such as the game number, date played stadium name, etc. Just like for the players’ stats, this sheet also serves more like a “relay sheet”.
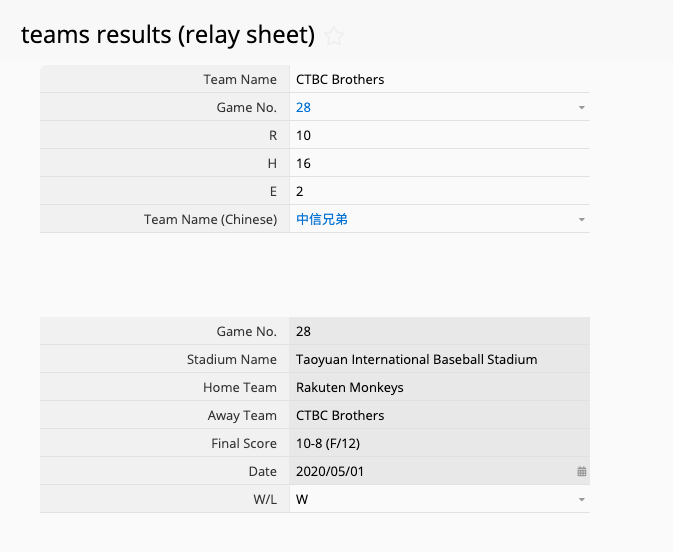
This new “relay sheet” for game results will then be referenced onto your standing sheet. Again, just like you other teams’ stats sheets, it will be easier to create this sheet by adding a new multiple versions sheet of the teams’ general information sheet so you would not have to create new links. If you would like to display the details of every game’s result of a team in the reference subtables, you may do so by selecting to show certain fields.
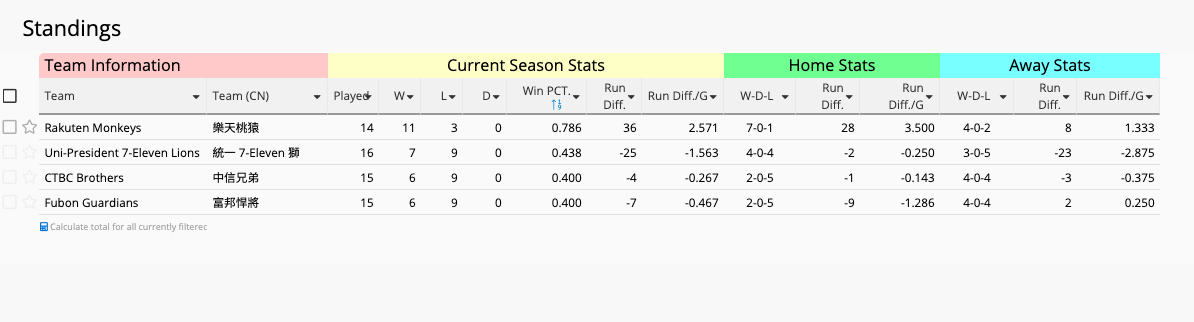
Finally, you can add new individual fields and apply formulas referencing the reference subtable to calculate the statistics of every team’s results in the season.
You will display the standings on the listing page since that is where you will be able to see the results statistics of all four teams. You can additionally sort on the listing page so your teams will be ordered in the criteria of your choice for rankings. For most professional sports, the teams should be sorted by their win percentage (Win PCT.) or points for standings calculations.
Formula Recalculation
To some extent, your forms will have a lot of complicated calculations across different sheets, and some cannot be executed automatically after you have completed your game boxscore sheet and used an action button to convert a game boxscore record. Therefore, you may set daily workflows to have all your formulas recalculated daily. In addition, you will see that workflow in job schedules under account settings, where you can also manually execute the recalculation of all sheets whenever you want.
Processing of Your Data
By now, you should already have your database fully functioning. All you need to do is to make sure you enter the data of your games in the game boxscore sheet and convert the records onto the relay sheets, which will then publish each games’ statistics on the respective reference subtables of every player. The reference subtables will then be used for calculating every players’ cumulative statistics this season. For teams’ stats, the reference subtable will be referencing the season statistics of every player and execute formulas to obtain the values for each team. As for calculating the game results, the standings sheet will have a reference subtable referencing the replay sheet created from the subtable of the game boxscores sheet. And just like other statistics calculations sheets, the standings sheet also uses formulas to calculate various related criteria.
Bonus: Making the Database Bilingual
This database is actually bilingual and processed on the Chinese CPBL Ragic forms since the baseball league has most of its data in Chinese. To make it bilingual, you will first need to create the English versions of all sheets with multiple versions. For most fields that will only contain numerical values, you’ll just need to translate the field headers on your English sheets. However, some of your fields will contain values that will be presented in different languages. To successfully translate those fields from Chinese to English, you can add new fields and use the conditional IFS() formula so your database can populate the corresponding English translation when selecting the value in your Chinese forms. On your multiple versions sheets, you can select to hide the fields presented with Chinese values if needed and it will not affect your database in any form. By making these edits on your sheets, your English and Chinese sheets will be linked and will update to both sheets when there are any modifications in either sheet.
Category: Applications > Use Cases

